Severe storms developing across the central and southern US plains on 25 May 2024 resulted in over 150 reports of hail, over 240 reports of severe wind, and over 40 tornados. GOES and JPSS satellite imagery provided useful details into the analysis of storm development and evolution.
A N-S oriented dryline had developed from w KS through s TX. NWS Midland, TX noted at 1959 UTC: “Quite an impressive moisture contrast across the CWA this afternoon. Dewpoints range from the single digits in the west to the low 70s in the east. Current satellite shows convection developing in the moist air east of the dryline which should remain east of our warning area though will have to monitor this closely as hi-res models are not handling this particularly well.”
GOES-East Split Window Difference (SWD) Imagery with IR overlay (for cold BTs) captured the exact location of the dryline well, complimenting the quantitative information from surface obs (Fig 1). Dry air behind the dryline appears as darker grays, while more moist airmass appears as lighter gray. In Fig 1, colors are cold BTs from IR, or cloud tops.
Figure 1: 25 May 2024 GOES-East SWD+IR Imagery.
While not as high of spatial resolution, the GOES TPW product does also detail the spatial extent of the dryline, while also quantifying the amount of moisture ahead of and behind the boundary (Fig 2).
Figure 2: 25 May 2024 GOES-East TPW+IR Imagery.
Overnight, the dryline made a slow retreat to the north and west, and was overtaken by some method of lift/boundary from the west, as indicated by the brightening (increasing) corridor of SWD from Fort Stockton to Abilene after 0300 UTC (Fig 3). Convection quickly developed within this corridor of relatively high SWD. These overnight storms produced severe hail and wind in the San Angelo area.
Figure 3: 25 May 2024 overnight GOES-East SWD+IR Imagery.
From NWS SPC regarding this region of overnight CI: “Over the past 30 minutes, a small cluster of cumulus has become evident in GOES IR and nighttime microphysics imagery to the northwest of the San Angelo, TX area along the surface dryline.”
Related Nighttime Microphysics RGB imagery is shown in Fig 4. The RGB imagery, which includes the SWD, captures the previously discussed region of suspected boundary interaction/lift as relative darkening, just prior to convective initiation (development of red).
Figure 4: 25 May 2024 GOES-East overnight Nighttime Microphysics RGB.
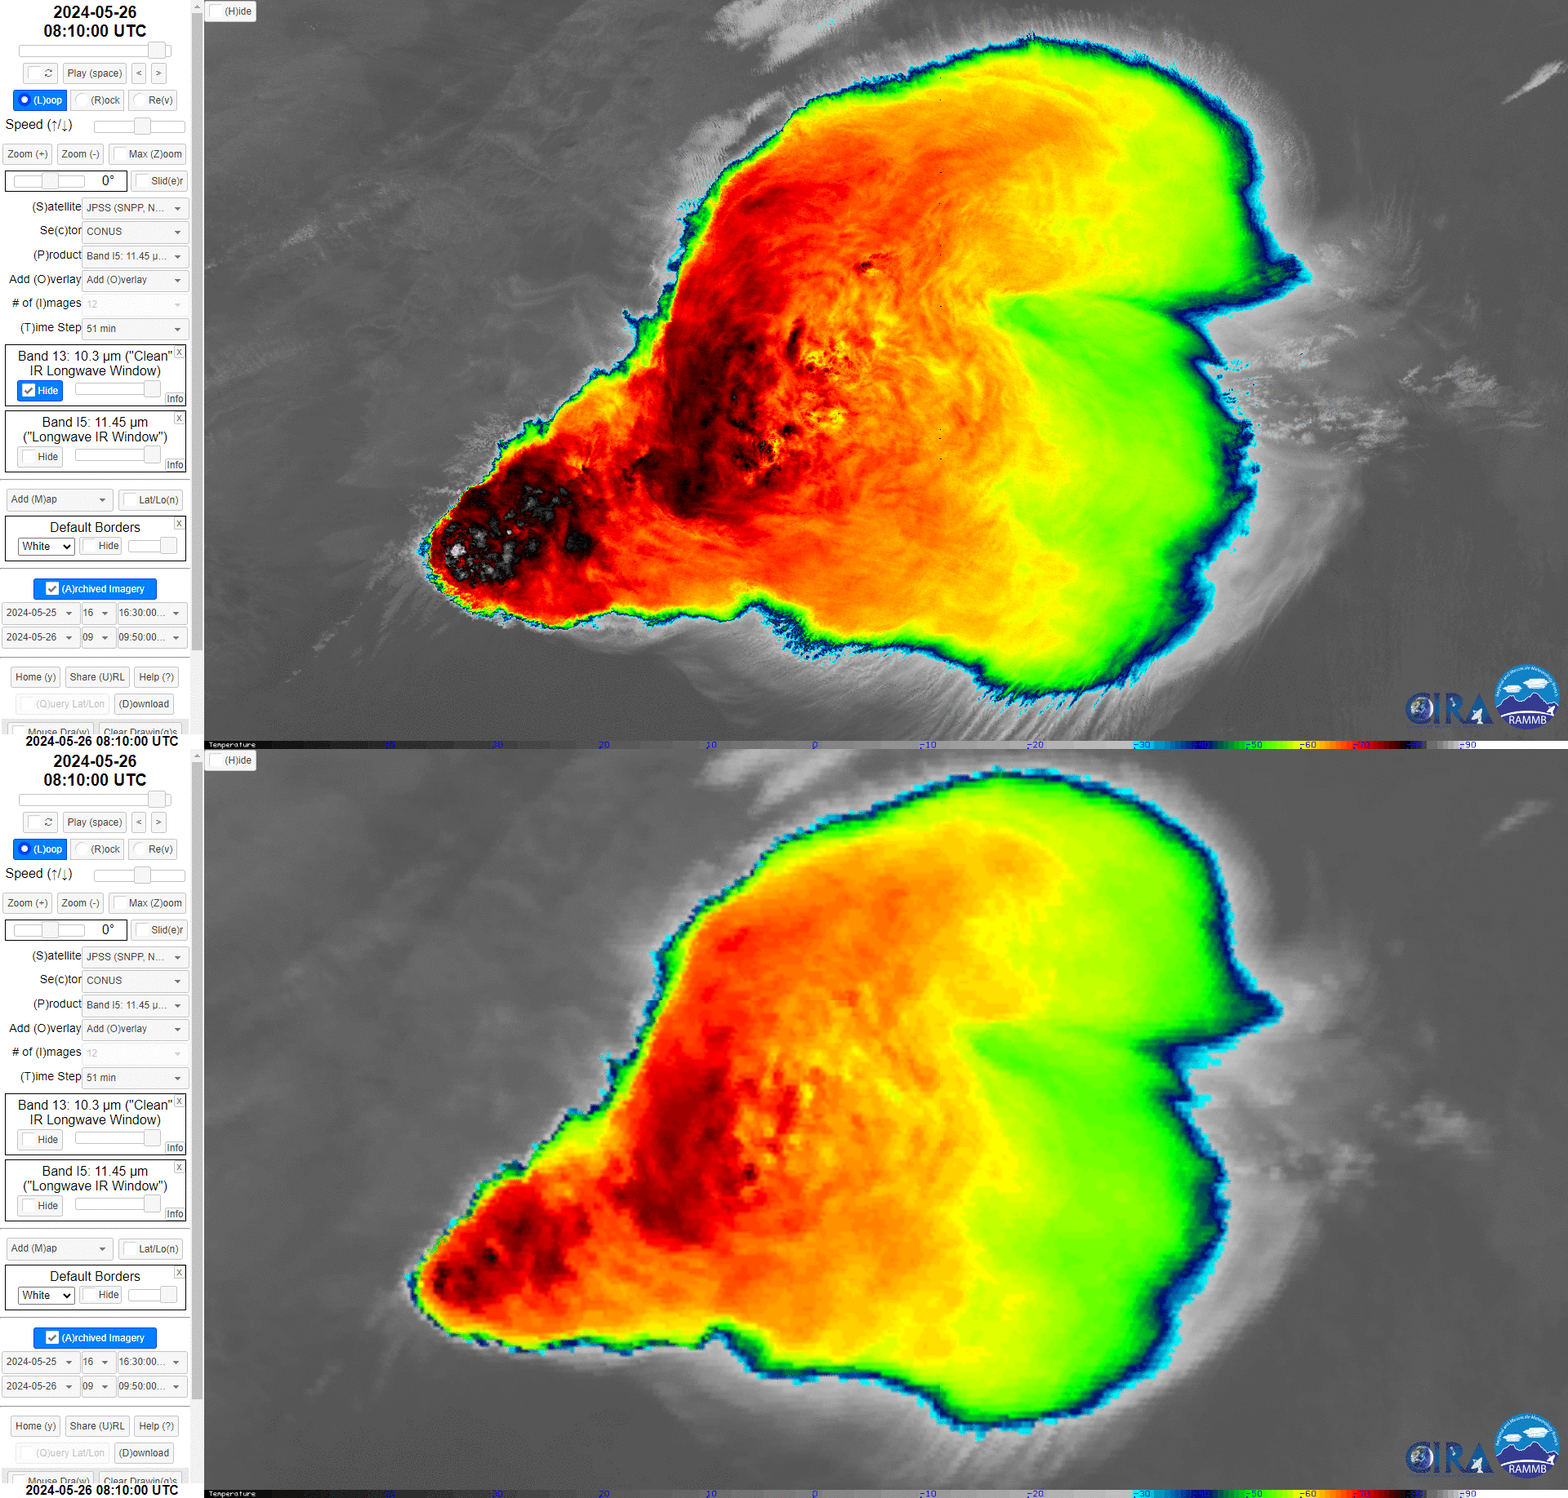
Overnight VIIRS Imagery provided detailed IR imagery (375-m) of the overnight Storm complex. Such imagery can be found on the CIRA Polar SLIDER Page, where it can be compared with GOES imagery, such as in Fig 5. Details in the storm top are quite clear in the VIIRS IR imagery, such as BT gradients and OTs, along with transverse banding and lower level cloud features.
Figure 5: 25 May 2024 overnight VIIRS 375-m IR, ABI 2-km IR.
Backing up to earlier in the day along the dryline, NWS San Angelo, TX wrote at 1823 UTC: “The latest severe weather/mesoanalysis analysis shows a dryline from Slaton to Midland to just west of Sanderson, moving slowly east. Also, meso sector 2 satellite imagery already indicates a few CI fails over Sterling and Coke counties. To the east of the dryline, there is extreme instability…”
GOES-East Meso-2 DCPD RGB imagery to go along with the NWS SJT discussion is shown in Fig 6. The failed CI attempts are highlighted in the imagery by transition from cyan colors to bright green colors, vertical growth, and a few orphan anvils.
Figure 6: 25 May 2024 GOES-East 1imin DCPD RGB Imagery.
Over the following hour, convection would quickly develop in the area of the previous failed attempts (Fig 7).
Figure 7: 25 May 2024 GOES-East 1imin DCPD RGB Imagery.
Looking at IR imagery further north, overnight convection would result in several tornados developing around the MO/AR border (Fig 8).
Figure 8: 25 May 2024 GOES-East overnight IR imagery.
Given that the moon phase was near Full, VIIRS Day Night Band NCC product, which provides visible imagery at night, revealed an excellent view of the scene (Fig 9). Focusing on the convective storm tops, relevant features like overshooting tops, above anvil cirrus plumes, and storm top gravity waves are easily diagnosed given the texture details. Also apparent in the imagery are lightning flashes in the storm tops, as well as surrounding city lights. Focusing on the region west of the mature convection, outflow boundaries and cumulus cloud development are observed. NCC imagery is available in AWIPS.
Figure 9: 25 May 2024 VIIRS overnight NCC imagery from S-NPP, N20, and N21. Single annotated NOAA-21 Image.
Bill Line, NESDIS/STAR


