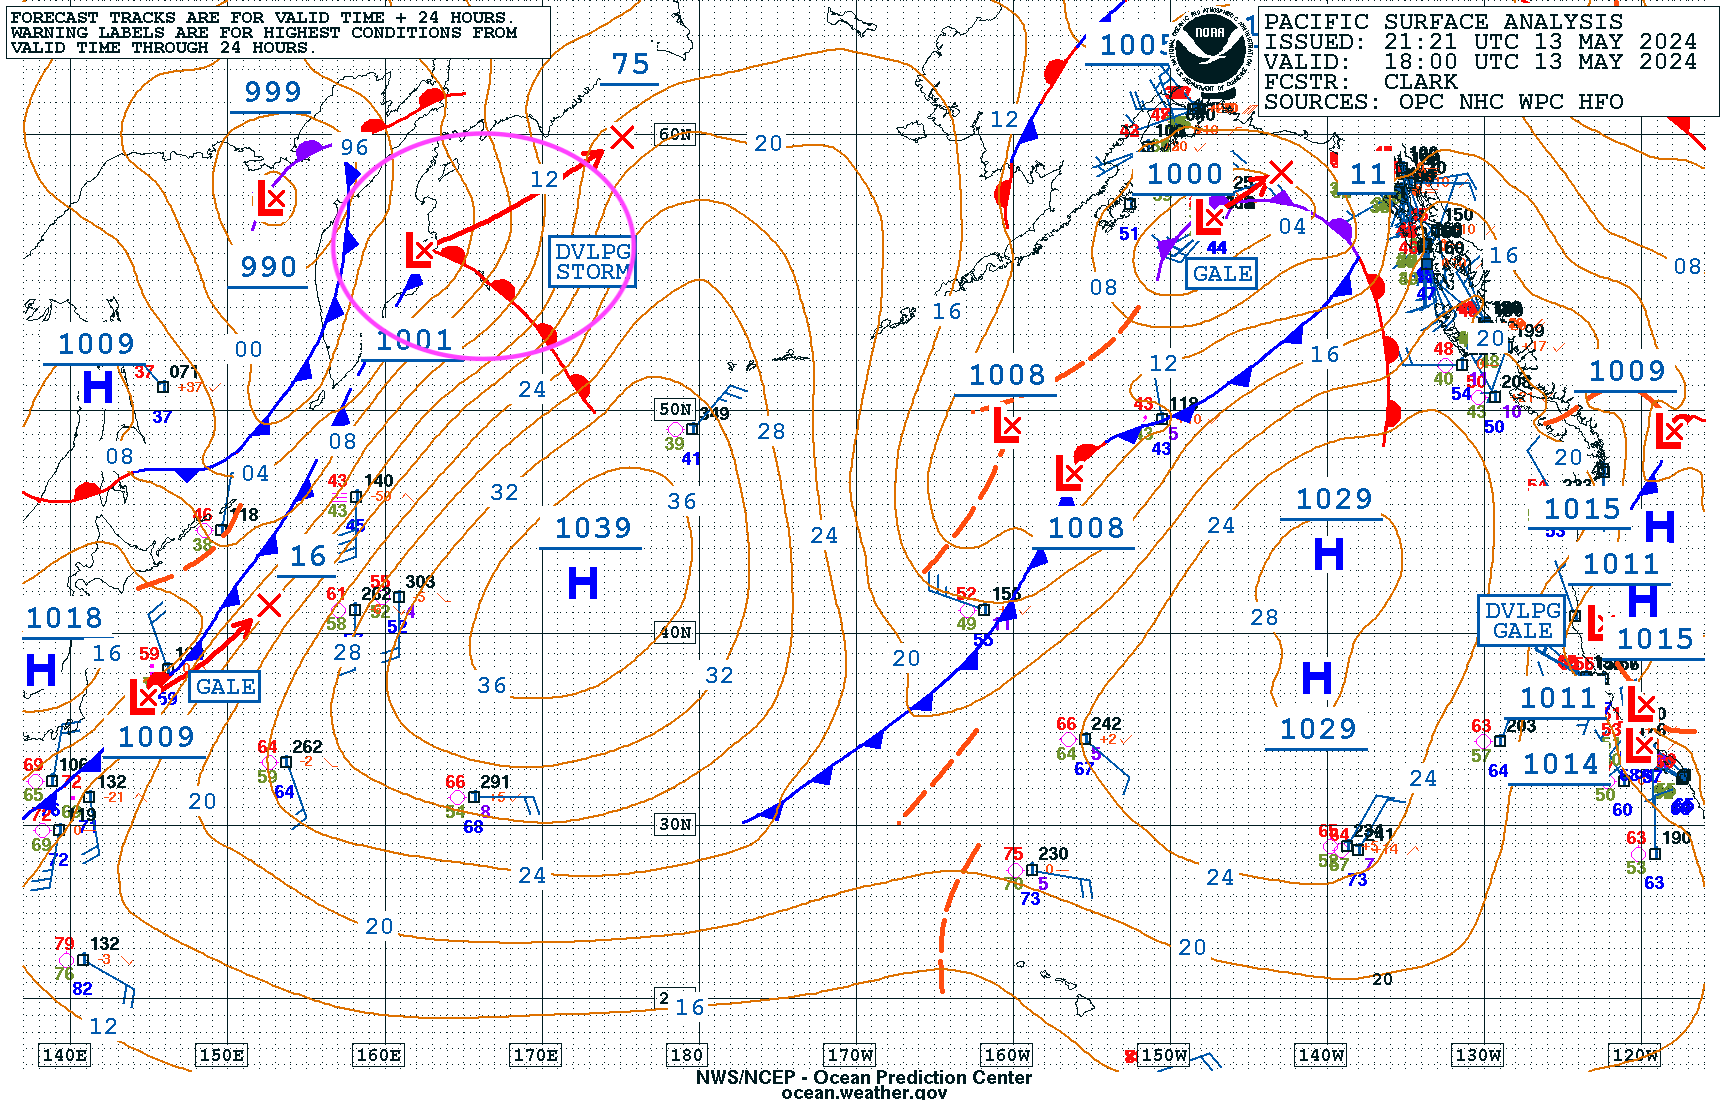
A mid-May storm-force low made its way into the Bering Sea on 14 May 2024. The 1800 UTC 13 May 2024 NWS Ocean Prediction Center (OPC) Surface Analysis showed a low pressure system developed in the Sea of Okhotsk, with a minimum central pressure of 1001 mb. By 1200 UTC 14 May 2024, the central pressure had dropped to 977 mb with the system in the Bering Sea, representing an 18-hour pressure drop of 24 mb, as the extratropical cyclone rapidly intensified.
Figure 1: OPC Surface Analysis valid 1800 UTC 13 May 2024
Figure 2: OPC Surface Analysis valid 1200 UTC 14 May 2024
Himawari-9 Airmass RGB imagery showed high-potential vorticity air quickly enveloping the extratropical cyclone from ~0000 UTC to 0800 UTC 14 May 2024. At the beginning of the animation, the deep oranges and reds are constrained to the western quadrants, but by the end, the colors encompass a wide footprint around the circulation, likely helping the system to maintain its strength.
Figure 3: Himawari-9 Airmass RGB imagery from ~0000 to 0800 UTC 14 May 2024 as the extratropical cyclone entered the Bering Sea. From CIRA Slider
The low briefly became storm-force valid 0600 UTC 14 May 2024, but by 1200 UTC 14 May 2024, the extratropical cyclone was a strong gale. A Metop-B/ASCAT pass valid ~0930 UTC 14 May 2024 did not show storm-force winds, but strong gales were still present. Due to the ASCAT pass occurring overnight for the area of interest, the pass was overlaid with Himawari-9 Proxyvis imagery to mimic visible imagery over ocean waters. In the image, you can see the terminator between visible imagery on the left and Proxyvis imagery on the right.
Figure 4: Metop-B/ASCAT pass valid ~0930 UTC overlaid on Himawari-9 Proxyvis imagery. This image was created in AWIPS.
In addition, altimeter wave heights ~0930 UTC exceeded 20 feet, just north of the area of strongest winds in the ASCAT pass.
Figure 5: Altimeter wave heights overlaid on Himawari-9 Proxyvis valid ~0930 UTC 14 May 2024. This image was created in AWIPS.
VIIRS GeoColor imagery, with its much higher resolution, captured an amazing view of the circulation valid ~0030 UTC to 0200 UTC 15 May 2024, while the extratropical cyclone was still a strong gale with a minimum central pressure around 974 mb. The JPSS imagery is especially useful at the high latitudes where the GOES ABI pixel size is much larger.
Figure 6: VIIRS GeoColor imagery valid ~0030 to 0200 UTC 15 May 2024. From CIRA Slider
CrIS Airmass RGB imagery also showed the potent gale traversing the Bering Sea from ~1300 UTC 14 May 2024 to ~0230 UTC 15 May 2024. CrIS imagery has been produced to improve the availability of water vapor imagery at the high latitudes, since ABI water vapor imagery is degraded at high latitudes and VIIRS lacks a water vapor band.
Figure 7: CrIS Airmass RGB imagery valid ~1300 UTC 14 May 2024 to ~0230 UTC 15 May 2024 with the extratropical cyclone over the Bering Sea. From CIRA Slider
The hyperspectral sounder CrIS imagery is available for S-NPP, NOAA-20, and NOAA-21 on the CIRA Slider.
Based on preliminary climatology put together by the OPC, May usually brings less hurricane-force extratropical cyclones in the North Pacific, but storm-force low pressures still pose a significant threat to mariners.
Chris Smith, CISESS GOES-R Satellite Liaison for NWS WPC/OPC


