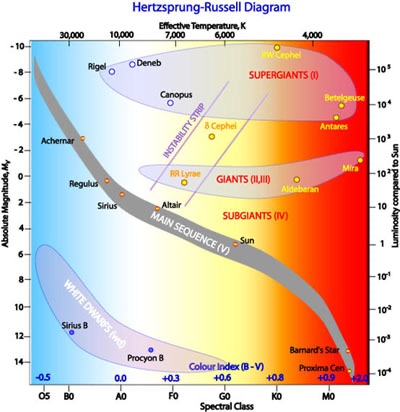
The H-R diagram was created around 1910 by Ejnar Hertzsprung and Henry Norris Russell, plotting stars’ absolute magnitudes or luminosities against their colors or temperatures. It shows that stellar properties are not random but follow distinct patterns.
The Hertzsprung-Russell (H-R) diagram is a scatter plot that shows the relationship between a star’s absolute magnitude or luminosity versus its stellar classification or effective temperature. It is a valuable tool in astronomy used to study and classify stars according to their evolutionary stages.
Key features of the H-R diagram include:
Axes
The vertical axis shows the star’s absolute magnitude (intrinsic brightness) or luminosity compared to the Sun. Brighter stars are plotted towards the top.
The horizontal axis shows the star’s spectral class (OBAFGKM), color index (B-V), or surface temperature, with hotter stars on the left and cooler stars on the right.
Main Regions
Main Sequence: A diagonal band running from the upper-left (hot, luminous stars) to the lower-right (cool, dim stars) where ~90% of stars lie, including the Sun. Stars on the main sequence are fusing hydrogen into helium in their cores.
Red Giants: Cool but luminous stars in the upper-right, more advanced in their evolution. Formed when stars exhaust hydrogen in their cores and expand.
White Dwarfs: Hot but dim stars in the lower-left, late in their evolution. Formed when low-mass stars shed their outer layers, leaving behind a hot, compact core.
Supergiants: Extremely luminous stars above the main sequence, formed from the most massive stars late in their evolution.
The H-R diagram is a powerful tool for understanding stellar evolution. As stars age, they move to different regions on the diagram corresponding to changes in their internal structure and energy production. It allows astronomers to determine a star’s evolutionary stage, as well as estimate star cluster ages from the main sequence turn-off point.
The Hertzsprung-Russell diagram is an essential instrument in stellar astrophysics for classifying stars and studying their evolutionary paths based on their luminosities and temperatures. Its elegant yet simple presentation of observational data has provided fundamental insights into the nature of stars.
Subscribe to our weekly newsletter which summarizes all articles from the previous week.


